Single-Cell Transcriptome Analysis Service
Humans are highly organized systems comprised of approximately 3.72×10¹³ cells of various types, which maintain proper organ function and normal cellular homeostasis. Despite significant and revolutionary discoveries in the field of cell biology, the heterogeneity of cells still requires further investigation. Single-cell RNA sequencing (scRNA-seq) has become the latest method for revealing the heterogeneity and complexity of RNA transcripts within individual cells, as well as for identifying different cell types and functional compositions within highly organized tissues/organs/organisms. Since its inception in 2009, studies based on scRNA-seq have provided a wealth of information across different fields, leading to exciting findings about the composition and interactions of cells in humans, model animals, and plants.
As single-cell RNA sequencing (scRNA-seq) technology advances, the number of cells it can analyze has increased, while the cost has exponentially decreased, and the number of published papers has continuously risen. In the past decade, the technology has evolved through more complex, accurate, and high-throughput analyses.
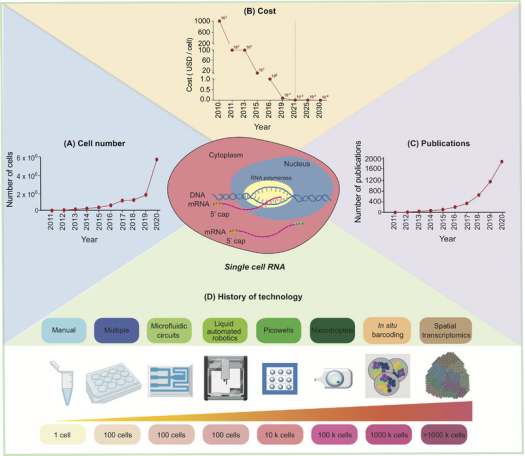
Figure 1. Development of scRNA-seq [1]
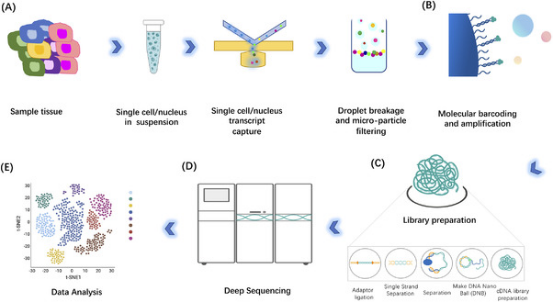
Figure 2. Workflow of scRNA-seq [1]
1. Sample Preparation
Preparing high-quality single-cell suspensions is key to the success of single-cell studies. Regardless of the starting material, the condition of cells is crucial for efficient cell capture and scRNA-seq protocol optimization. Although fresh, living single cells are used in most methods, preserved samples and nuclear RNA from frozen tissues can also be used in some other methods. In principle, as long as poly(A)-tailed RNA is present, the application of scRNA-seq is not limited to specific species. Some organisms may require additional processing steps to effectively release molecules out (e.g., removing cell walls from plant samples).
Single cells are isolated from suspensions (e.g., blood samples) using density centrifugation (such as with Ficoll-Paque or Histopaque-1077), then directly used for single-cell capture. Solid tissues must first be dissociated through mechanical and enzymatic processing. Initially, tissues are broken down through mechanical cutting, followed by enzymatic digestion to digest cells through specific enzymes with different digestion time for different tissues. Enzymes include Accutase, elastase, and collagenase, as well as commercial enzyme mixtures like TrypLE Express and Liberase Blendzyme3. Increased cell lysing leads to cell clumping, which can be reduced during the cell separation process by treating with DNase I. Finally, before capturing individual cells, the suspension is filtered through a sieve or mesh.
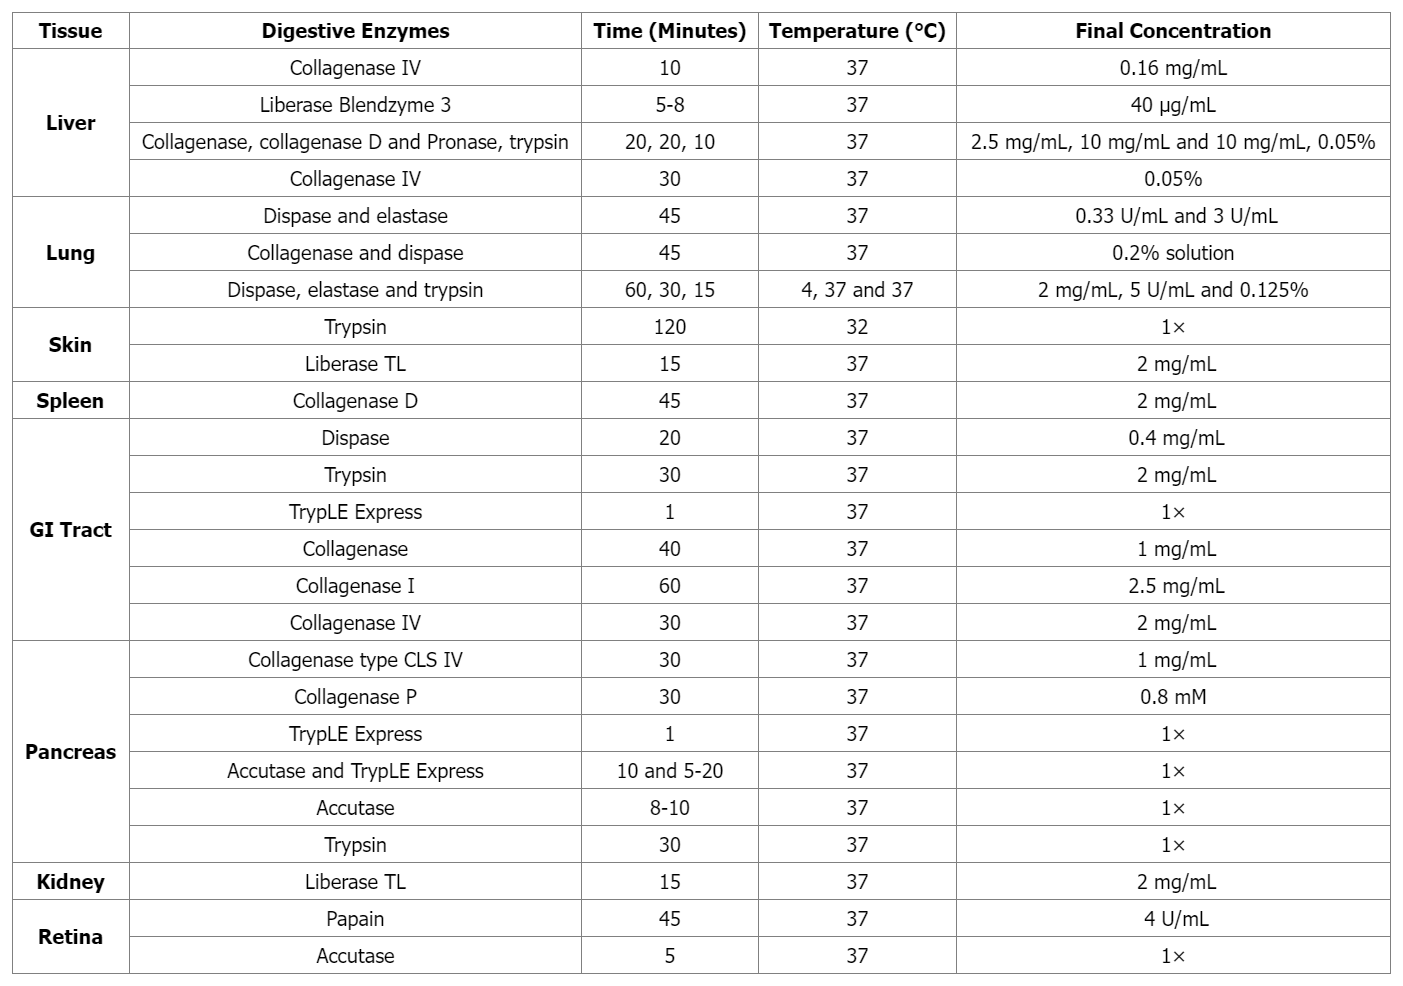
Table 1. Tissue-specific Enzymatic Treatments for Preparing Single-Cell Suspensions
(1) Precautions
① It is recommended to employ aseptic sample handling techniques, including using reagents and materials free of nucleases.
② To minimize cell damage, it is advisable to minimize pipetting and centrifugation.
③ Under the given centrifugation speed, time, and temperature, cell concentration and size will affect the efficiency of single-cell separation. If tissue cells are tightly connected, additional pipetting operations may be needed, which might cause cell damage because of shearing effects; therefore, centrifugation conditions should be optimized. Sufficient volume should be used during cell washing and resuspension because high concentrations can lead to cell aggregation and clumping.
④ The suspension should be filtered through a cell strainer with an appropriate size (pore size larger than cell diameter) to remove clumps and debris.
⑤ It is recommended to use phosphate-buffered saline containing bovine serum albumin (without calcium and magnesium) for cell washing and resuspension, to minimize cell loss and aggregation. Primary cells, stem cells, and other sensitive cell types might require different buffers for washing and resuspension to ensure their viability.
⑥ Cell clumps can lead to the underestimation of the concentration of single cells by automatic cell counters, therefore, the suspension should be processed as soon as possible after its preparation, ideally within 30 minutes.
⑦ Minimizing cell aggregation, dead cells, extracellular nucleic acids, and reverse transcription (RT) inhibitors during the preparation of single cells is crucial. To minimize these impurities while maximizing the purity and full recovery of different types of cells, optimization may be necessary (e.g., the number of washing steps, composition of the washing solution, centrifugation conditions, and/or filter type).
For single-cell transcriptomic analysis, most methods require physical separation of cells into individual reaction volumes. High-throughput experiments generally use fluorescence-activated cell sorting (FACS) or microfluidic techniques to guide cells into micro-liter or nano-liter reaction systems. Microfluidic systems can capture cells into integrated fluidic circuits (IFC), droplets, or nanopores. Thus thousands of cells are analyzed at once, while minimizing reaction volume and reagent use. FACS sorts cells into microplate wells to enable library preparation by manual or automated processes, and help to exclude dead or damaged cells to enrich target cell populations. it is advised to also process the single-cell solutions in microfluidic systems with FACS or magnetic-activated cell sorting (MACS) to remove debris, dead cells, and cell aggregates to reduce background and maximize detection.
2. Single-Cell RNA Sequencing
The transcriptomic spectrum of a single cell can be divided into four main parts: RNA molecule capture, reverse transcription and transcriptome amplification, sequencing library preparation, and sequencing. There are various scRNA-seq methods, but they all employ the same fundamental principles.
(1) RNA Molecule Capture for Sequencing Library Preparation
Most scRNA-seq methods capture poly(A) tail RNA, but specific protocols also exist for analyzing total RNA or miRNA. After a single cell is lysed, poly(T) oligonucleotides capture poly(A) tail RNA, so other RNA types such as rRNA and tRNA are excluded. After capturing RNA, it is reversely transcribed into stable cDNA, with most methods incorporating single-cell-specific barcodes into the poly(T) oligonucleotides for multiplex analysis of mixed samples. Moreover, random nucleotide sequences in the poly(T) oligonucleotides can serve as unique molecular identifiers (UMIs) to correct amplification biases and reduce technical noise.
(2) Reverse Transcription
Reverse transcription is a critical step, and different schemes have been optimized in various ways. Efficient enzymes and specific additives are used to maximize efficiency. Reverse transcriptase enzymes are derived from moloney murine leukemia virus (MMLV), which, due to their reverse transcriptase virus origin, initially had low sustained synthesis capabilities and high error rates. Different mutation points have been introduced to enhance sustained synthesis capabilities to enable the reverse transcription of very long RNAs (up to 12-14 kb). SuperScript II is a commonly used enzyme, popular in the single-cell field due to its template switching characteristics, and is used in methods like Smart-seq2 and STRT-seq.
To overcome the limitations of MMLV-based RT enzymes, various additives have been tested over the years. Trehalose has thermal stabilizing and protective effects on RT enzymes, while it will enhances the unfolding of secondary RNA structures when applied to the RT reaction at higher temperatures, which might hinder its sustained synthesis capabilities. Later, expansions to using betaine alone or in combination with trehalose were made to improve thermal protection and associated cDNA yield for RT enzymes. Smart-seq2 and STRT-seq-2i use betaine and magnesium chloride. Research has also utilized T4g32p, a single-stranded binding protein, to improve yield and sustained synthesis capabilities during RT.
(3) Transcriptome Amplification
cDNA can be amplified through PCR or in vitro transcription (IVT). IVT methods, often applied in CEL-seq, MARS-Seq, and inDrop-seq protocols. IVT do not produce biases through linear amplification of molecules, but requires an additional round of reverse transcription of the amplified RNA into cDNA and a sequencable library. PCR, a nonlinear amplification process, is used in Smart-seq, Smart-seq2, FluidigmC1, Drop-seq, 10xGenomics, MATQ-seq, Seq-Well, and DNBelabC4. PCR requires less operational time but its exponential amplification stage can cause biases of RNA content in the final library. Both methods provide interpretable results and have been successfully applied in various scRNA-seq methods.
(4) Sequencing
Once single-cell barcoded cDNA is generated from single cells or single-cell nuclei, it can be sequenced on many deep sequencing platforms. Single-cell transcriptomic analysis can be completed through full-length transcript analysis or counting of 3′/5′ end of transcripts, with the choice of sequencing method depending on experimental objectives. 3′/5′ end counting is a cost-effective quantification strategy, and significantly loses transcript sequence information. full-length transcriptome sequencing detects splice variants and alternative transcripts, as well as gene modifications of the transcription part. Unlike 3′/5′ methods, full-length schemes do not allow the introduction of UMIs, which leads to higher library preparation costs. Long-read sequencing techniques, which do not require library fragmentation, can overcome this limitation. However, these technologies produce fewer sequencing reads, thus not yet enabling transcriptome quantification.
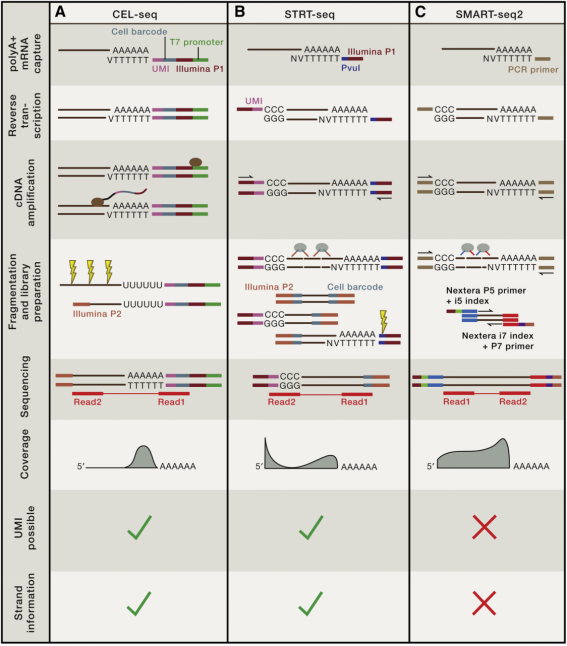
Figure 3. Three Common Experimental Schemes for Single-Cell Sequencing [2]
3. Data Processing
The classic roadmap for scRNA-seq data analysis mainly includes data preprocessing, general analysis, and exploratory analysis. Data preprocessing includes quality control, alignment, and quantification; general analysis includes filtering of low-quality cells filtering, normalization, HVG selection, dimension reduction, clustering, and cell type annotation; exploratory analyses includes DEG analysis, function enrichment, GSVA, TF prediction, cell trajectory, cell-cell interaction, cell cycle, and spatial transcriptome analysis.
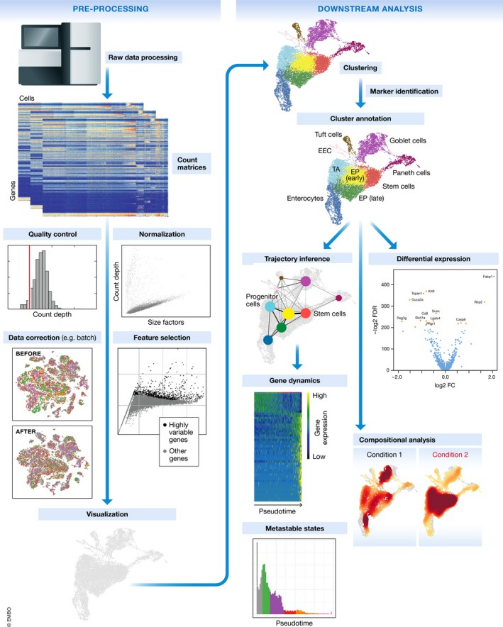
Figure 4. Single-Cell Sequencing Data Processing Workflow [3]
(1) Quality Control
The first step of scRNA-seq is to exclude cell barcodes that are unlikely to represent complete single cell. A critical step for high-throughput methods is to filter out cell barcode that do not represent a cell. The most direct method is to calculate dataset-specific thresholds, i.e., the minimum number of UMIs required for a barcode to be considered as representing a cell. However, this method cannot differentiate between intact live cells and damaged or dead cells. A second round of quality control must be conducted with consideration of the number of detected genes, the proportion of RNA from mitochondrial genomes, and the ratio of non-applicable or multi-mapped reads in each cell. Cells with high proportions of mitochondrial-derived genes, few detected genes, or high ratios of unmapped or multi-mapped reads are usually damaged or dying cells. Specific thresholds are often determined by manually inspecting quality control metric charts because the optimal cutoff values depend on the tissue, dissociation scheme, and other technical factors. Defining outlier cells (median absolute deviation) can directly build dataset-specific thresholds, but should be applied cautiously, especially in samples composed of highly heterogeneous cell types.
Some cell barcodes may represent background noise, a cell barcode may also correspond to multiple cells. Typically, about 5% of cell barcodes can label multiple cells, known as doublets. Moreover, recent studies suggest that in up to 20% of cases, multiple cell barcodes may label the same single cell. Tools such as scrublet and DoubletFinder can simulate potential double barcodes from the dataset itself, which then calculate the similarity between real droplet barcodes and simulated double barcodes to define a threshold to distinguish inferred double barcodes and assumed single barcodes.
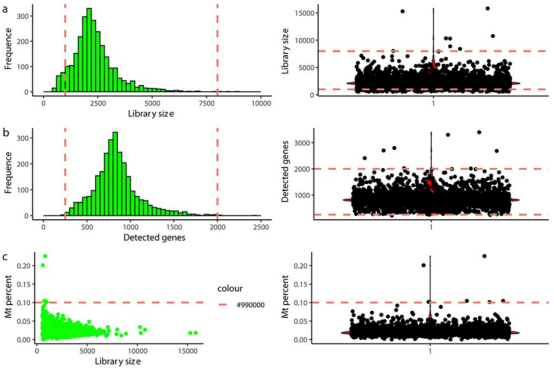
Figure 5. Example of scRNA-seq Data QC Using Fixed Thresholds [3]
(2) Data Normalization
The number of useful reads obtained from sequencing experiments varies by cell, so this variance must be corrected. For scRNA-seq data, this effect is particularly noticeable, as the amount of RNA per cell can vary significantly depending on the cell cycle stage and other biological factors, even within the same cell type. Technical factors, such as different droplet sizes, may further increase the difference in sequencing depth. Difference caused by uneven sequencing depth can be improved through normalization.
For bulk RNA sequencing data, normalization is to calculating a value related to sample sequencing depth, commonly called as "size factor", and then all gene expression levels are divided by the value. In principle, similar methods can also be used for scRNA-seq. The scran software estimates the size factor by using cell pools to achieve better results. Additionally, housekeeping genes can also be used to estimate the size factor. Due to the presence of many zeros, low-expressed genes may perform differently at different sequencing depths compared to high-expressed genes. To compensate for this flaw, normalization strategies tailored to each gene's expression level can be used. For example, SCnorm can be used for low-throughput, high-depth data, while sctransform can be used for high-throughput, low-depth data.
(3) Batch Effect Correction
Batch effects are a common phenomena in biology, arising from differences in non-biological factors such as experimental time, experimenters, or reagents. If not properly considered, batch effects can be mistaken for real biological signals, but with careful experimental design, batch effects can be completely avoided. Batch effect correction is most effective when all biological conditions are handled across all batches, known as "balanced design". Unfortunately, when samples cannot be processed simultaneously (for example, if cells need to be processed immediately after collection), a balanced design is often unfeasible.
Traditional batch correction methods, such as ComBat, assume that the biological conditions of each cell are a priori known, and use this information to distinguish biological effects from batch effects through a linear model. However, this assumption often does not suit scRNA-seq data, because the cell type identity of individual cells may not be clear. To address this challenge, mnnCorrect uses the mutual nearest neighbors relationship between cells from different batches to retrospectively identify common biological conditions across batches. This mutual nearest neighbors approach is also used to find "anchors" for Seurat's canonical correlation analysis (CCA) method. The main difference between these tools is that mnnCorrect uses PCA to remove batch effects from the gene expression matrix, while CCA projects cells into a common gene correlation space and performs corrections in that space. However, even these single-cell-specific tools assume that the biological conditions of different batches are the same, which can incorrectly remove real biological signals if applied to mixed experiments.
(4) Data Analysis
Single-cell sequencing data analysis can be divided into four types: data preprocessing, general analysis, exploratory analysis, and optional analysis.

Figure 6. Single-Cell Sequencing Methodologies [1]
① Data preprocessing: The basic formats of raw single-cell transcriptome sequencing data include FASTQ and BCL, which depend on the data source and sequencing platform. Since only FASTQ files can directly implement quality control, if the original data is not in FASTQ format, the first step is to convert it to FASTQ format using appropriate tools. FASTQ files can be generated from BCL files using cellranger mkfastq, a pipeline that wraps the bcl2fastq software. Importantly, in addition to the path to the BCL files, a simple CSV matrix file containing at least three columns (lane, sample, and index) should be provided. Then, FastQC can be used to assess the quality of the raw single-cell RNA sequencing data.
② General analysis: After the data has been processed through quality control, normalization, and remove of batch effects, feature selection and dimension reduction clustering analysis for it are typically performed. Feature selection identifies genes with the strongest biological signals relative to technical noise. By limiting downstream analysis to the most informative genes, dimension effects can be reduced, noise can be minimized, and analysis can be simplified. Another strategy to reduce the negative impact of high dimension of the expression matrix is reduction of feature space narrowed. There are many available methods, but the most commonly used strategy involves principal component analysis (PCA), a linear transformation that preserves the euclidean distances between cells in the complete PCA space. Even for very large datasets, it can also calculate efficiently. Most scRNA-seq datasets are complex, and their structures cannot be captured by two to three principal components. The current best practice is the uniform manifold approximation and projection (UMAP) dimension reduction method. This algorithm approximates the topological structure of the data using a cell-cell nearest neighbor network, then estimates the embedding of the data in low-dimensional space that best preserves the structure. Because UMAP is able to better preserve large-scale structures, it has largely replaced t-distributed stochastic neighbor embedding (t-SNE).
The complexity of single-cell RNA sequencing data has spurred the development of various clustering methods. Clustering can assign a biological annotation to each cluster for the foundation for subsequent analysis. From a comprehensive perspective, SC3 and Seurat perform better among these methods, with Seurat being several orders of magnitude faster. When the number of clusters is the same, Seurat usually has the best consistency with the actual partition. If the number of clusters is higher than actual number, FlowSOM has better consistency with the actual partition. Typically, the workflow for annotating cells in scRNA-seq data includes three main steps: automated annotation, manual annotation, and wet lab validation. Initially, major automated annotation tools utilize a set of predefined marker genes, which are specifically expressed in known cell types to label clusters by matching gene expression patterns to known cell types. The advantages of automated cell annotation methods are that they are fast, repeatable, and often more reliable in annotating common cell types. However, due to the limitations of the reference marker gene set, they cannot define rare and new cell types. Ten common cell type annotation methods include Seurat, scmap, SingleR, CHETAH, SingleCellNet, scID, Garnett, SCINA, CP, and RPC. Finally, wet lab experiments are usually needed to further validate the findings of scRNA-seq. Traditional validation methods include immunofluorescence and immunohistochemistry, both of which are based on the principle of specific binding of antibodies to antigens (surface proteins encoded by marker genes) to demonstrate the true existence of cell types obtained from data analysis.
③ Exploratory analysis: To reliably reveal the functional bias and biological significance of specific cell groups, it is necessary to perform functional enrichment analysis on targeted differentially expressed gene sets. The general analysis strategy for functional enrichment also applies to single-cell data, such as GO analysis and KEGG analysis. Pseudotime analysis can be used to infer the trajectory of cells at the single-cell level, with the potential to discover rare cell types and states. Monocle is one of the most widely used tools for pseudotime analysis. Organisms self-regulate in response to stimuli to maintain internal balance, which requires the coordinated participation of multiple cell types. With the rapid development of cell-cell communication research, tools for analyzing cell-cell communication are no longer limited, including CellChat, CellPhoneDB, NicheNet, SingleCellSignalR, and iTalk.
④ Optional analysis: The analysis of single-cell sequencing data still has many other important aspects that deserve more attention and exploration, such as the joint application of scRNA-seq and CRISPR screening, the comprehensive analysis of scRNA-seq and multi-omics, etc. The combination of these techniques allows for a better and deeper understanding of key biological processes and mechanisms, and is an important direction for the future development of single-cell technologies. In the field of single-cell RNA transcriptome research, there is still great potential in analysis algorithms and tools to improve data exploration and better understand cell function.
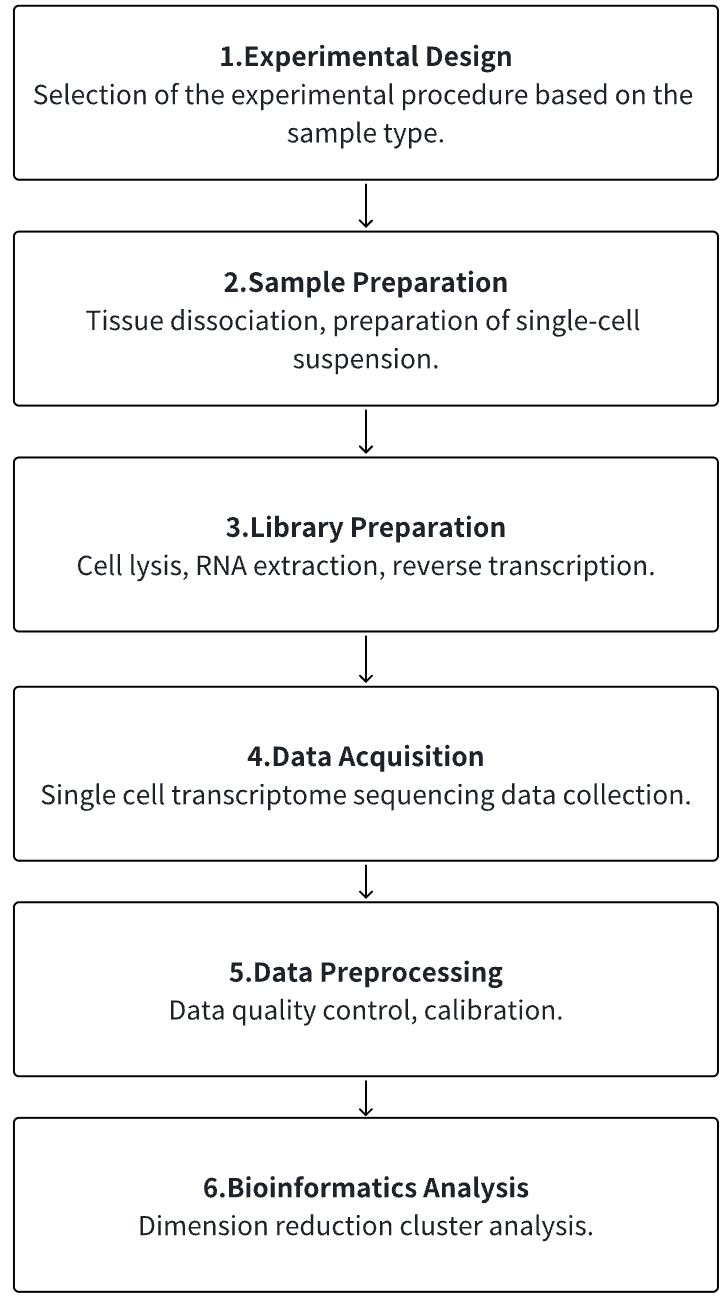
Analysis Workflow
1. According to the Experimental Requirements to Determine the Experimental Process
2. Tissue Dissociation, Preparation of Single-Cell Suspension
3. Cell Lysis, RNA Extraction, Reverse Transcription
4. Single Cell Transcriptome Sequencing Data Collection
5. Data Preprocessing
6. Advanced Bioinformatics Analysis
Service Advantages
1. Adaptation to Multiple Types of Sample Detection
2. High-reliability, High-precision Single Cell Sequencing Service
3. Comprehensive Bioinformatics Analysis
Sample Results
1. Cardiac Single-cell RNA-seq Revealed the Intercellular Communication Drivers of Myocardial Fibrosis in Diabetic Cardiomyopathy
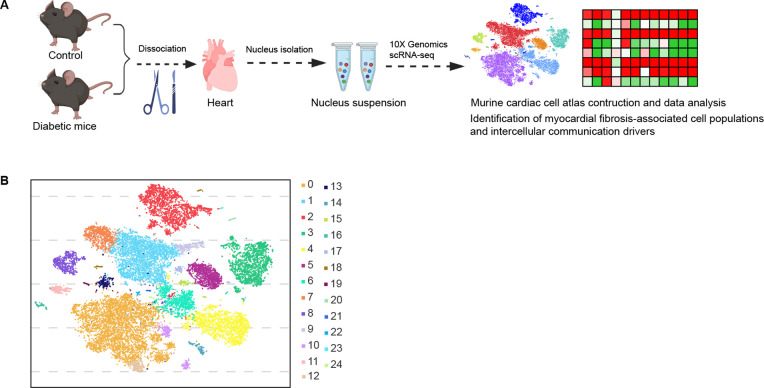
Figure 7. Experimental Design and Cell Type Characterization [5]
2. High-throughput Single-cell RNA Sequencing Revealed the Spatiotemporal Developmental Trajectories of Arabidopsis Roots
High-throughput single-cell RNA sequencing (scRNA-seq) is becoming a cornerstone in developmental research, providing unprecedented power to understand dynamic processes. A study proposed a high-resolution scRNA-seq expression atlas of Arabidopsis roots consisting of thousands of independently profiled cells. This atlas provides detailed spatiotemporal information, identifying the defining expression characteristics of all major cell types, including the scarce cells in the quiescent center. These revealed key developmental regulators and downstream genes that transform cell fate into unique cell shapes and functions. Developmental trajectories derived from pseudotime analysis depicted the fine cascades of cell progression from niche through differentiation that were supported by the mirrored expression waves of highly interconnected transcription factors. This study demonstrated the power of applying scRNA-seq to plants and provided a unparalleled spatiotemporal perspective on root cell differentiation.
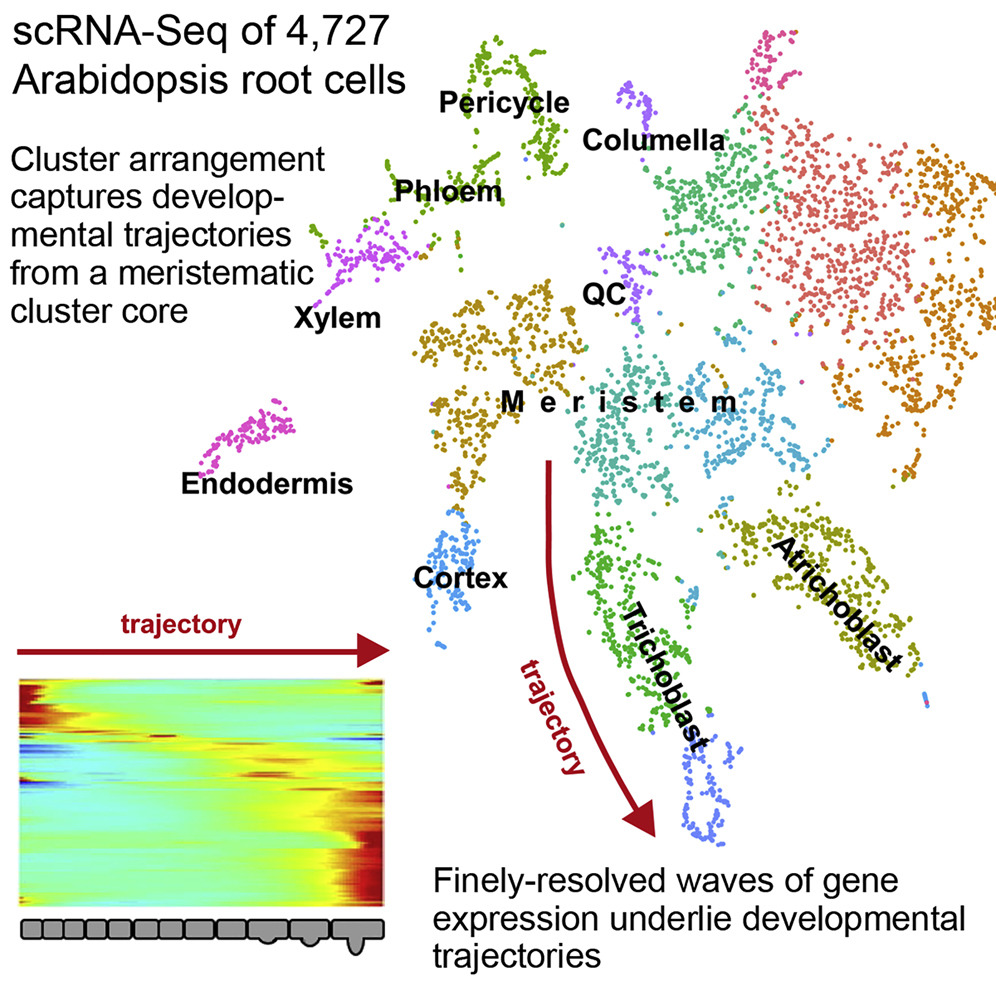
Figure 8. High-Throughput Single-Cell RNA Sequencing Reveals the Spatiotemporal Developmental Trajectories of Arabidopsis Roots [9]
3. Single-cell RNA-seq Combined with Multi-omics Revealed SERPINE2 as a Target for advanced Renal Cell Carcinoma Metastasis
Tumor growth, metastasis, and treatment response in advanced renal cell carcinoma (RCC) are thought to be regulated by the tumor and its microenvironment (TME). However, the mechanisms of genomic, transcriptomic, and epigenetic changes during RCC progression have not been fully elucidated. A study obtained scRNA-seq data from 8 RCC patient tissue samples, including two pairs of matched primary sites and metastatic sites (lymph nodes), as well as Hi-C, transposable accessible chromatin high-throughput (ATAC-seq), and RNA-sequencing (RNA-seq) between RCC (Caki-1) and human renal tubular epithelial cell line (HK-2). The identified targets were validated in clinical tissue samples (407 RCC patients' microarrays, TMA-30, and TMA-2020), and their functions were further validated through in vitro and in vivo experiments by knockdown or overexpression. The findings indicated that the different expression patterns of malignant cells and TME play different roles in the progression of RCC. SERPINE2 has been identified as a potential therapeutic target to inhibit advanced RCC metastasis.
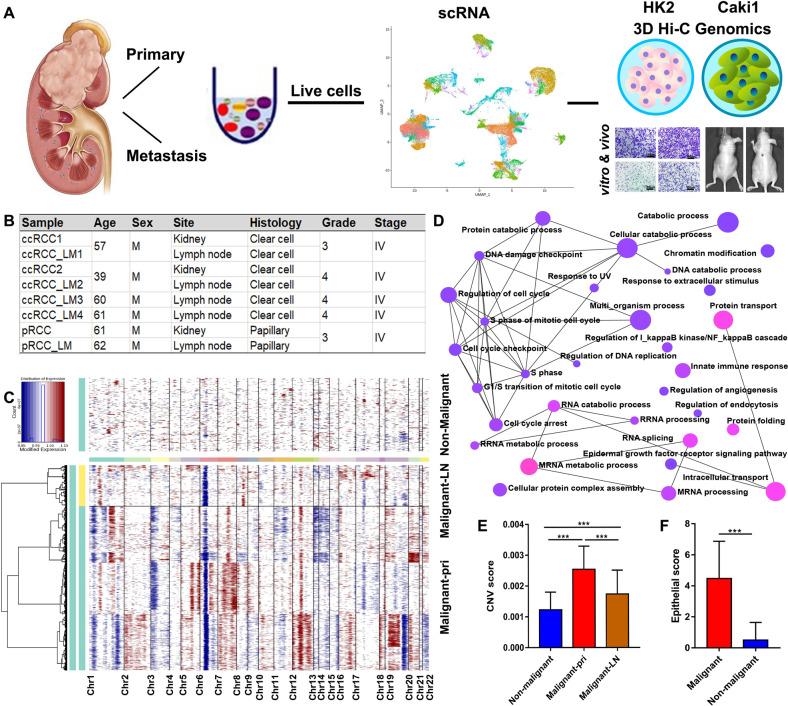
Figure 9. Multi-omics Combination Reveals SERPINE2 as a Target for advanced Renal Cell Carcinoma Metastasis [7]
Sample Submission Requirements
1. Cell quantity and concentration: It is recommended to have 5 × 10⁵ Cells and a concentration of 1000 cells/ μ L.
2. Cell activity: greater than 80%, it is recommended to build a risk library of 105.
3. Cell diameter: 5 μ M ≤ X ≤ 30 μ M.
4. Try to avoid impurity contamination.
Services at MtoZ Biolabs
1. Experimental Procedure
2. Relevant Mass Spectrometry Parameters
3. Raw Data
4. Data Analysis Reports
Applications
1. Cell Type Identification
The most important application of single-cell mRNA sequencing might be its identification of cell types in complex mixtures. The transcriptome of a cell can be interpreted as revealing its identity. Therefore, unbiased screening of randomly sampled cells from mixtures (e.g., organs) can reveal the cell composition of the sample. Single-cell RNA expression profiling is rapidly becoming an indispensable method in various studies, including humans, animals, and plants, enabling more accurate and rapid identification of rare and new cell in tissues. Moreover, by integrating information on gene expression, metabolites, cell-cell communication, and spatial landscapes at mRNA and protein levels, the challenges of cell composition and function in health and disease can be addressed. Although the initial discoveries and uses of scRNA-seq were mainly completed on animal and later human cells, sequencing in plant science is still in its early stages, with many exciting challenges yet to be overcome.
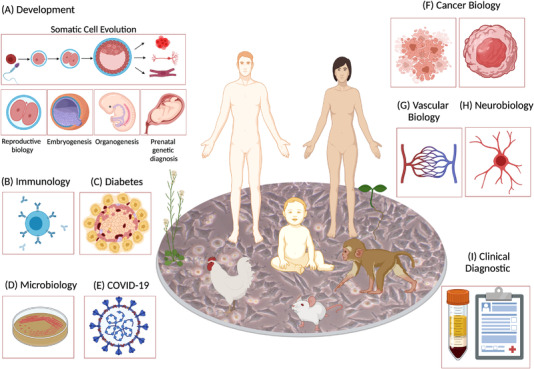
Figure 10. Applications of scRNA-seq [1]
FAQ
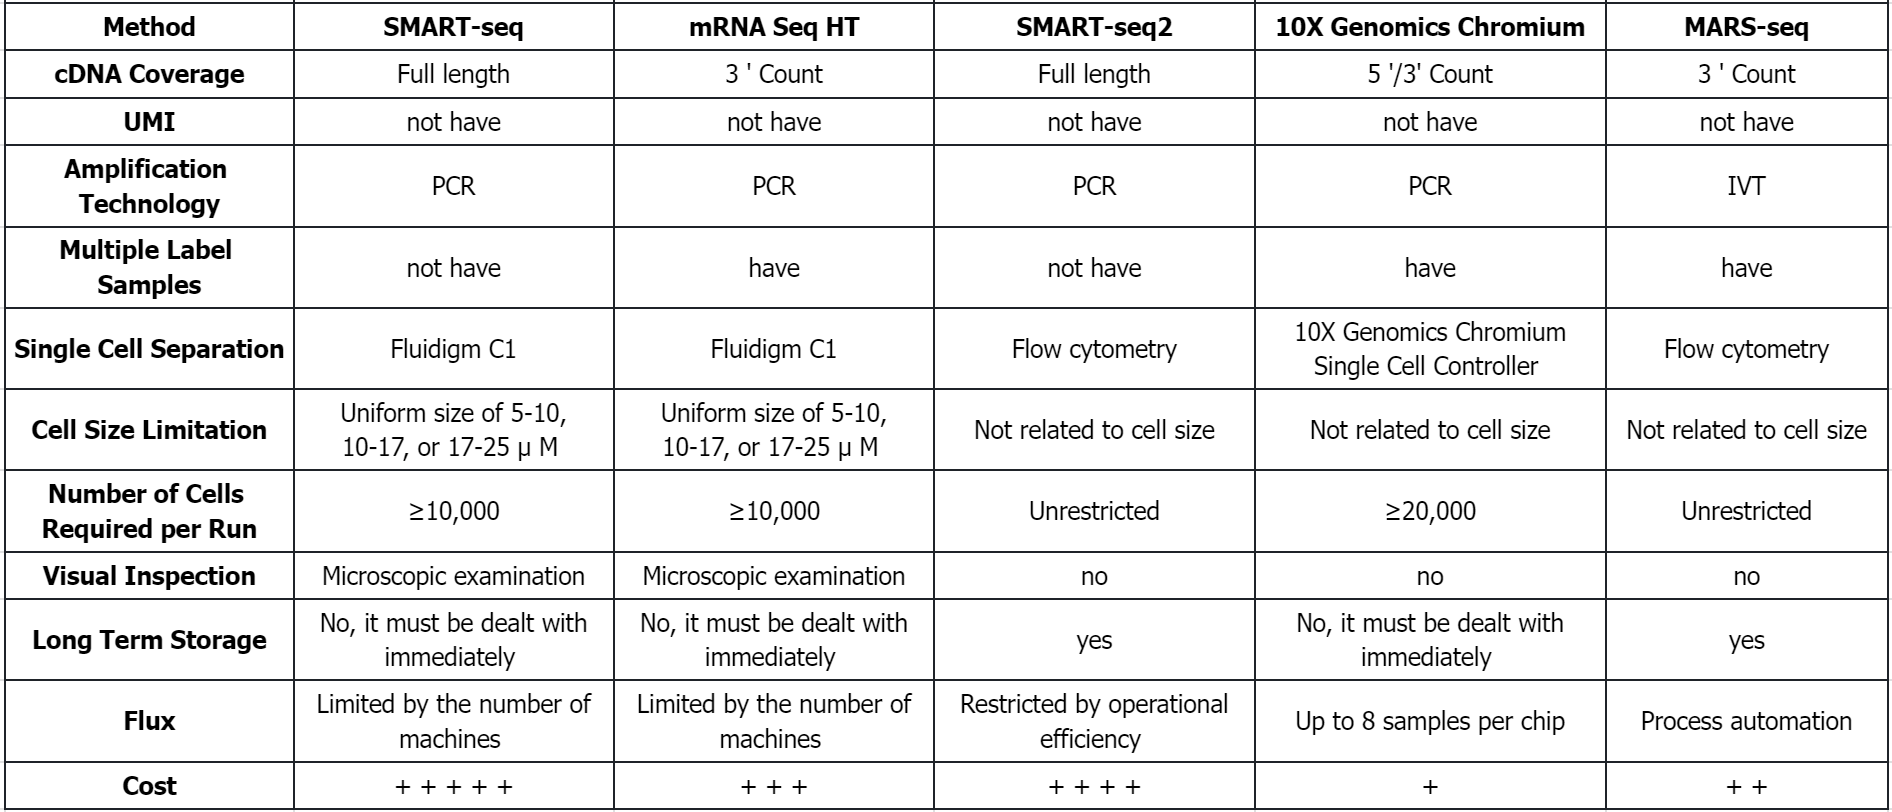
Q1: What are the comparison of different sequencing methods?
References
[1] Jovic D, Liang X, Zeng H, Lin L, Xu F, Luo Y. Single-cell RNA sequencing technologies and applications: A brief overview. Clin Transl Med. 2022 Mar;12(3):e694. doi: 10.1002/ctm2.694. PMID: 35352511; PMCID: PMC8964935.
[2] Grün D, van Oudenaarden A. Design and Analysis of Single-Cell Sequencing Experiments. Cell. 2015 Nov 5;163(4):799-810. doi: 10.1016/j.cell.2015.10.039. PMID: 26544934.
[3] Luecken MD, Theis FJ. Current best practices in single-cell RNA-seq analysis: a tutorial. Mol Syst Biol. 2019 Jun 19;15(6):e8746. doi: 10.15252/msb.20188746. PMID: 31217225; PMCID: PMC6582955.
[4] Zhang Z, Cui F, Wang C, Zhao L, Zou Q. Goals and approaches for each processing step for single-cell RNA sequencing data. Brief Bioinform. 2021 Jul 20;22(4):bbaa314. doi: 10.1093/bib/bbaa314. PMID: 33316046.
[5] Li W, Lou X, Zha Y, Qin Y, Zha J, Hong L, Xie Z, Yang S, Wang C, An J, Zhang Z, Qiao S. Single-cell RNA-seq of heart reveals intercellular communication drivers of myocardial fibrosis in diabetic cardiomyopathy. Elife. 2023 Apr 3;12:e80479. doi: 10.7554/eLife.80479. PMID: 37010266; PMCID: PMC10110238.
[6] Denyer T, Ma X, Klesen S, Scacchi E, Nieselt K, Timmermans MCP. Spatiotemporal Developmental Trajectories in the Arabidopsis Root Revealed Using High-Throughput Single-Cell RNA Sequencing. Dev Cell. 2019 Mar 25;48(6):840-852.e5. doi: 10.1016/j.devcel.2019.02.022. PMID: 30913408.
[7] Chen WJ, Dong KQ, Pan XW, Gan SS, Xu D, Chen JX, Chen WJ, Li WY, Wang YQ, Zhou W, Rini B, Cui XG. Single-cell RNA-seq integrated with multi-omics reveals SERPINE2 as a target for metastasis in advanced renal cell carcinoma. Cell Death Dis. 2023 Jan 16;14(1):30. doi: 10.1038/s41419-023-05566-w. PMID: 36646679; PMCID: PMC9842647.
How to order?


